


Texas Coastal Geology
Richard L. Watson, Ph.D.
P.O. Box 1040 Port Aransas, TX 78373
361-749-4152 send email
Richard@TexasCoastGeology.com
Click
here to
read Dr. Watson's invited article titled "Evaluation of coastal response
to Hurricane Ike through pre-storm and post-storm aerial photography"
in Shore
and Beach Vol. 77,
No. 2, 49-59. This entire
issue of Shore
and Beach, the Journal
of the
American Shore and Beach Preservation Association
is dedicated to
description and analysis of the damage to the Louisiana and Texas
coasts by Hurricane Ike which came ashore on September 13, 2008.
See
also the following paper which is
the introduction to this issue of Shore and Beach.
**********************
Dr.
Watson presented a lecture titled Ike
wiped entire towns off of the map. Are we safer in Port
Aransas?
The presentation was made at the University of Texas Marine
Science
Institute in Port Aransas, TX on March 12, 2009 to a standing room only
crowd. The slide show includes before and after photos of the
upper
Texas coast destroyed by Ike, Ike's effects on Mustang and N. Padre
islands, and comparison to past hurricanes and the flooding that they
caused at Port Aransas. You can click on the link below to
watch
and
listen to this narrated presentation. However, the file is
very
large,
about 46 mb and it is probably better to download it and watch it
offline.
**********************
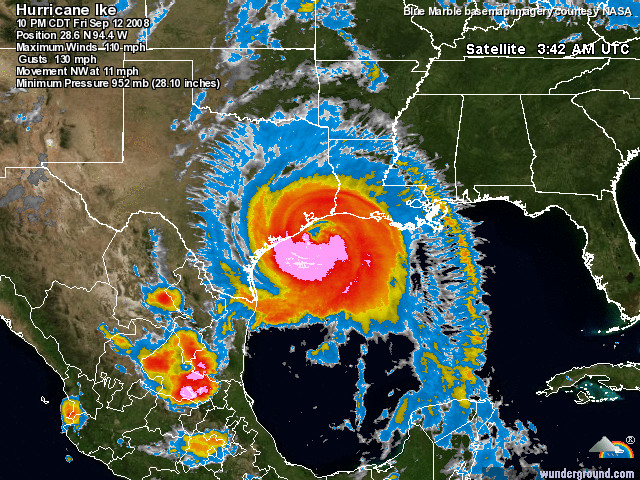
Hurricane
Ike - September, 12, 2008
Dr. Watson presented
a talk titled Was
Hurricane Ike a wake-up call, or are we going back to sleep? on
January 15, 2008
at the Corpus Christi
museum of Science and
Technology
Today
(9/15/2008) I flew from Rockport, TX to High Island, TX and back.
I took over 300 photos of the damage from Hurricane Ike.
You can click on the link below to see these photos.
The
towns of Caplen and Gilchrist are GONE! The wind damage at
Galveston
is far less than the TV folks would have you believe, although there is
a great amount of flooding damage, especially on west end.
Likewise at
Surfside Village.
High
resolution digital
copies of many of
these photographs are available for sale. You may purchase a digital
photo in the highest resolution that I have for $25.00 for personal use
or for use in your presentations. The charge will be $150 for use
in
publications or for commercial reproduction. Contact me to
purchase
photos. These photographs
are
copyrighted and are the property of Richard L. Watson. They
may
not be copied or used without permission. You may however
link to
this website from your website or by email.
The following is a video
interview that I gave to the Corpus Christi Caller-Times to help people
understand hurricane surge. The video and the interview were
taken on September 12, 2008 as Hurricane Ike was approaching Galveston,
TX. The video and the discussion is about the Corpus Christi
area
with video clips from Port Aransas, Packery Channel, Flour Bluff,
Corpus Christi Bay and the Padre Island Seawall. The video
interview was prepared by Michelle Christenson of the
Caller-Times.
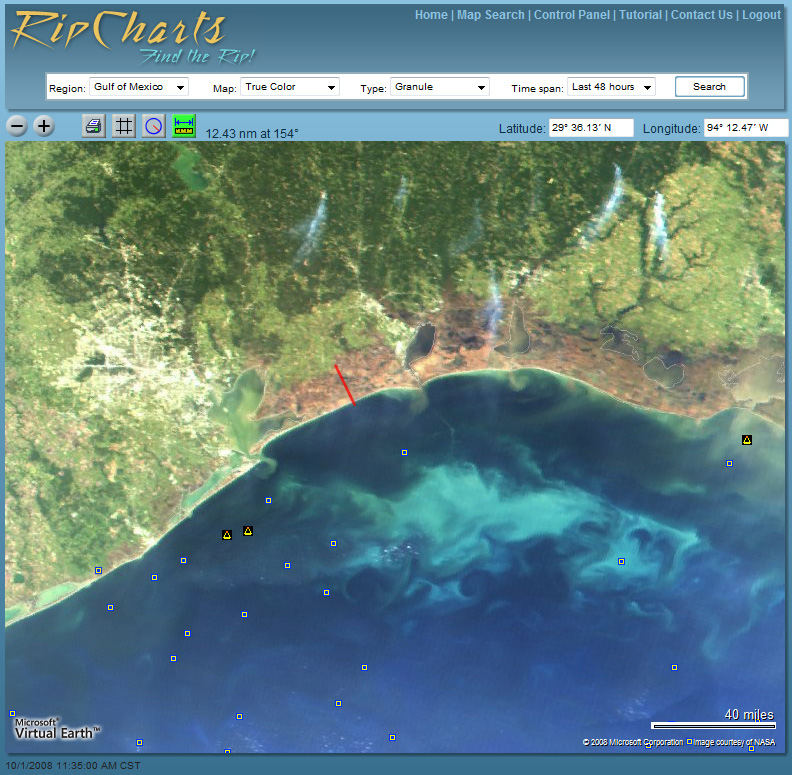
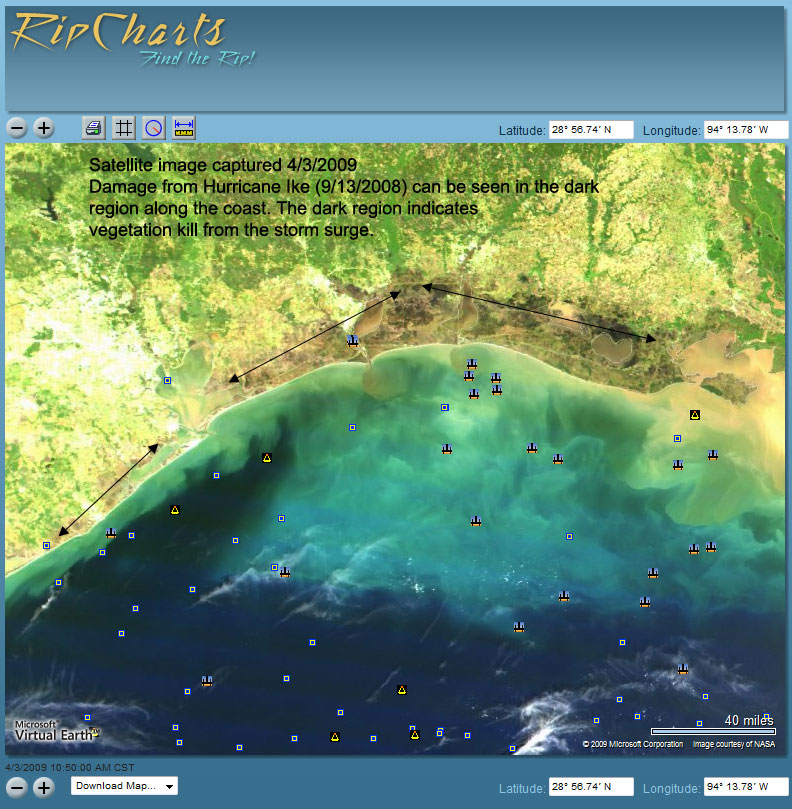
The
owner of
http://www.ripcharts.com/ has provided the following two
satellite photographs. They show the inundation by Hurricane
Ike
as brown dead vegetation. The red line shows an intrusion of
12.4
nautical miles.
Radar
image of Hurricane Ike approaching Galveston, Texas
Here is a graph of the
Hurricane
Ike surge at Morgan Point in Galveston Bay, Clear Lake, Pier 21
Galveston, the Galveston Pleasure Pier and at Port Aransas, Texas.
It appears that the water level gauges on the Pleasure Pier
and
Pier 21 died with the surge. The water level reported is the
water level above Mean High Water, the average of all high tides for
18.6 years. Data
obtained from the Texas Coastal Ocean Observation Network, Division of
Nearshore Research, Conrad Blucher Institute for Surveying and Science,
Texas A&M University-Corpus Christi. It
looks like most
of the gauges in the Galveston-Houston area died during the storm,
including the Galveston Pleasure Pier (blue),

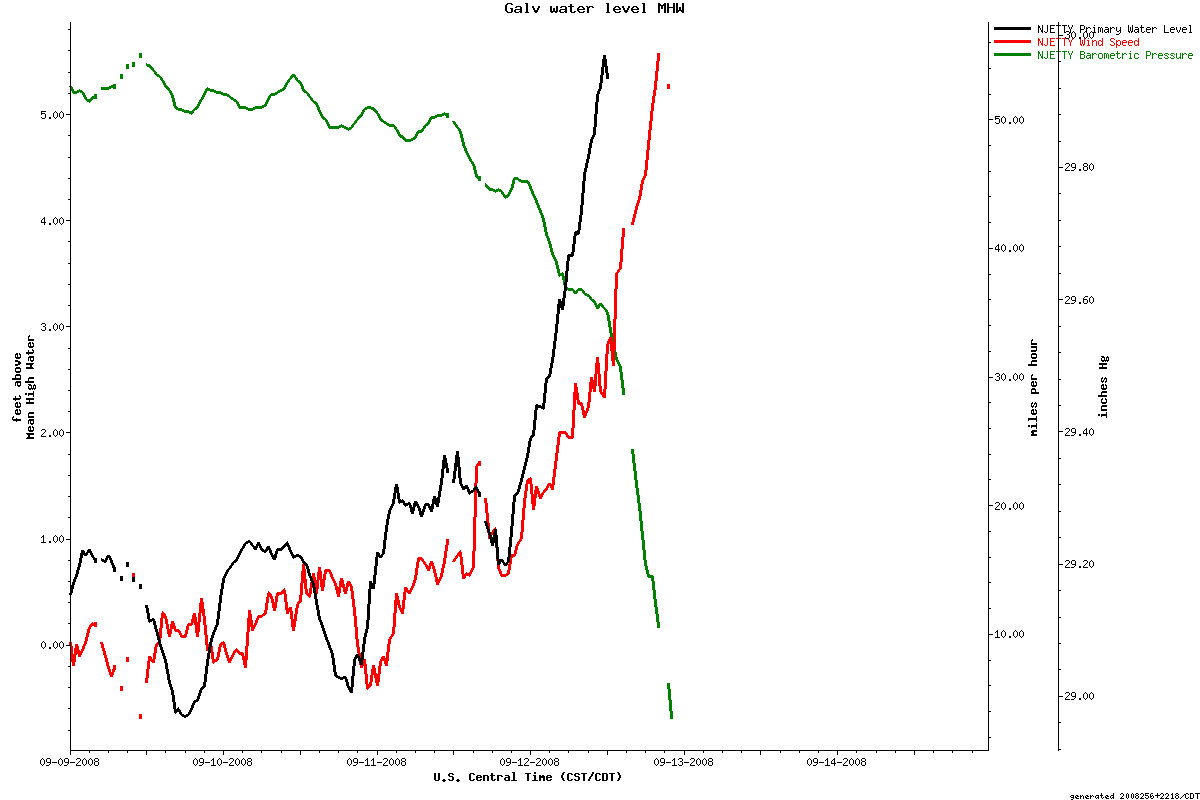
The following graph shows the
Hurricane Ike surge at a gauge on the
north jetty at Bolivar Roads, the Galveston entrance channel.
Note that the wind and barometric pressure are included.
The water level is the level above Mean High Water as in the
graph above. Data
obtained
from the Texas Coastal Ocean Observation Network, Division of Nearshore
Research, Conrad Blucher Institute for Surveying and Science, Texas
A&M University-Corpus Christi.
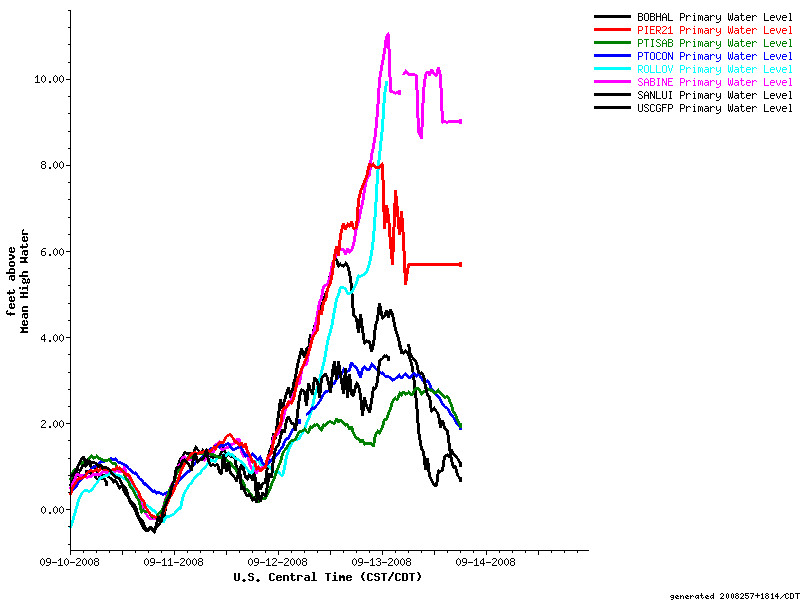
Here
is Ike's surge for the entire
Texas Coast.
The stations include
Sabine
Pass, Rollover Pass, Pier21 Galveston, San Luis Pass, USCG Freeport,
Bob Hall Pier (North Padre), and Port Isabel. Data
obtained from the Texas Coastal
Ocean Observation Network, Division of Nearshore Research, Conrad
Blucher Institute for Surveying and Science, Texas A&M
University-Corpus Christi.
Here
is Ike's track and intensity of history
**********************
Hurricane Rita Track, 2005
Hurricane
Rita Landfall
**********************
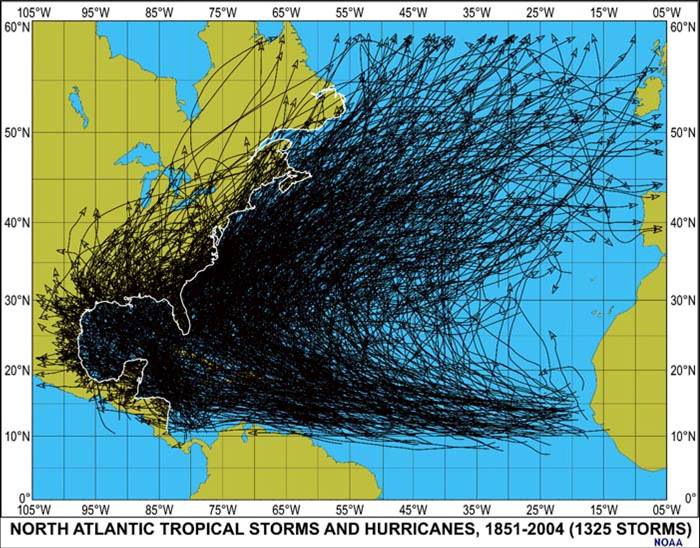
Just
in case you don't think that we are going to get any more tropical
storms and hurricanes, take a look at the tracks of 150 years worth of
storms!
**********************
Historical
hurricane
flood and surge maps
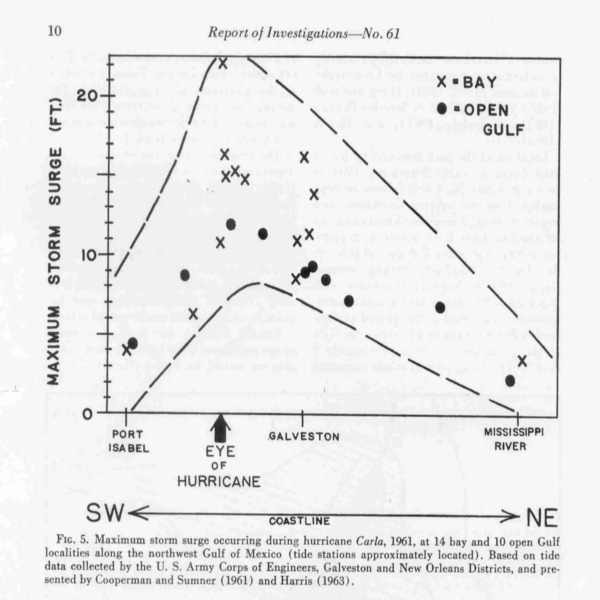
Effect
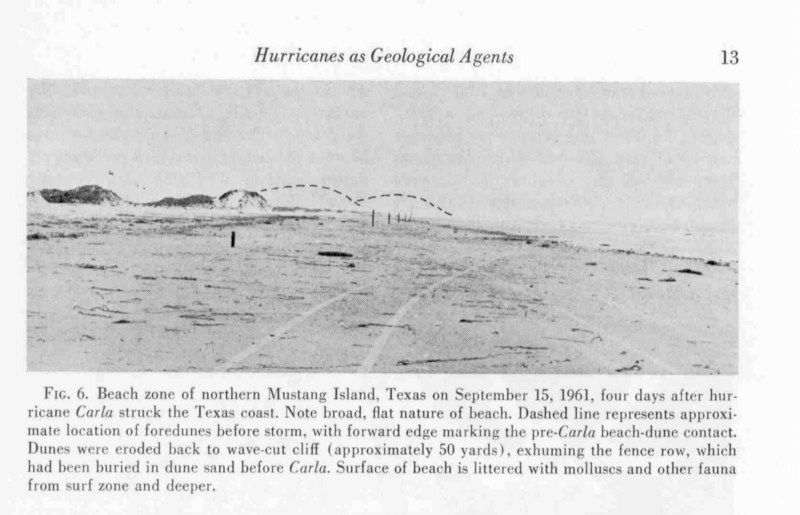
of Hurricane Carla at Port Aransas in 1961
The following illustrations are taken from Hurricanes
as Geological Agents: Case Studies of Hurricanes Carla, 1961, and
Cindy, 1963 by Miles O. Hayes, University of Texas Bureau of Economic
Geology, Report of Investigations no. 61.
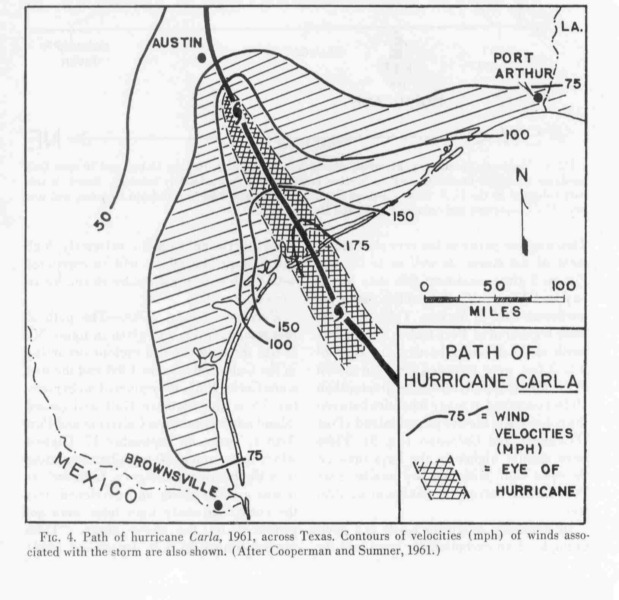
This
first figure shows the wind
field of Hurricane Carla.
Note that the hurricane force winds extended nearly the
entire
length of the Texas coast and inland almost to Austin. Port
Aransas sustained winds in excess of 100 mph even though Port Aransas
is located far to the west of the landfall near Port O'Connor.
Carla was a large diameter, very powerful hurricane.
This
illustration shows the distribution of the height of the
water level, the hurricane surge from Carla. It is
interesting to
note that his huge storm had only about a maximum 12 ft. surge on the
open Gulf beaches. The surge in the bay at Port O'Connor was
at
least 22 ft., 10 ft. higher than on the adjacent Gulf beaches.
This is because the storm filled the bay with water and then
blew
all of that water to the downwind side of the bay. The
hurricane
surge is generally HIGHER in bays than on the open Gulf beaches.
We need for our natural dune seawall to be high enough and
wide
enough to protect us from hurricane surge overwash from the Gulf.
Even though we may still be flooded by water from the bay
side of
the island, there will be much less damage than if we are overwashed
with direct Gulf surge topped by hurricane waves.
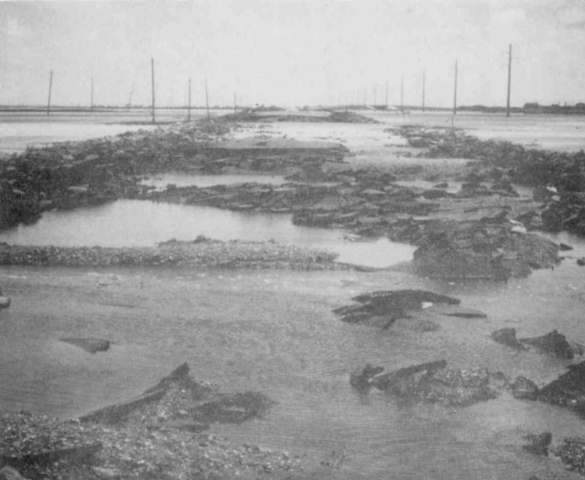
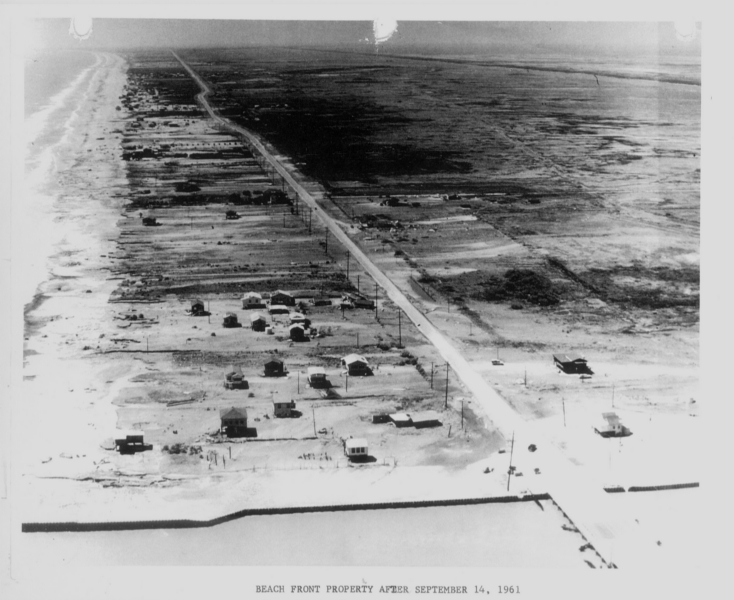
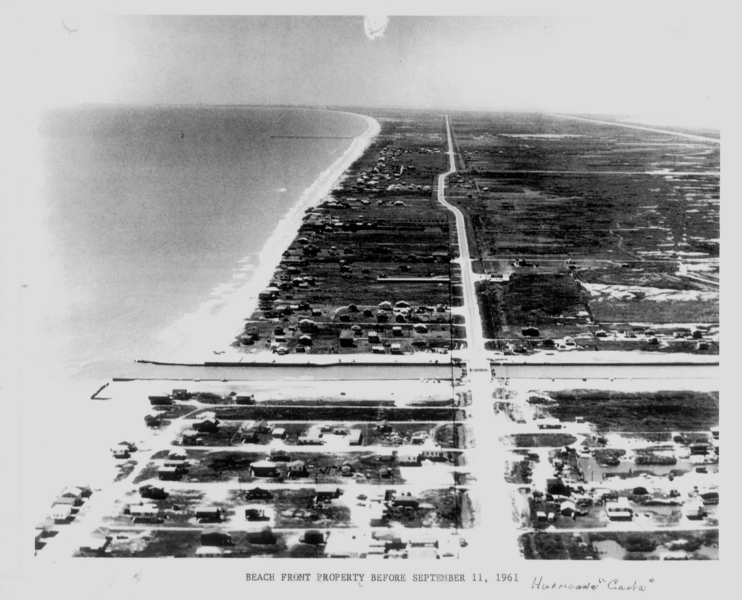
This photograph
dramatically
shows the massive erosion of the dunes on Mustang Island by Carla.
The sand that those dunes gave up helped to protect the town
and
bought time for the storm to pass. The dunes have since
rebuilt
in the interim before the next bad storm.
Rollover Pass after
Hurricane Carla (1961)
Note
that Hurricane Carla made landfall about 130 miles southwest of
Rollover Pass. It was a huge storm.
Rollover
Pass before Hurricane Carla (1961)
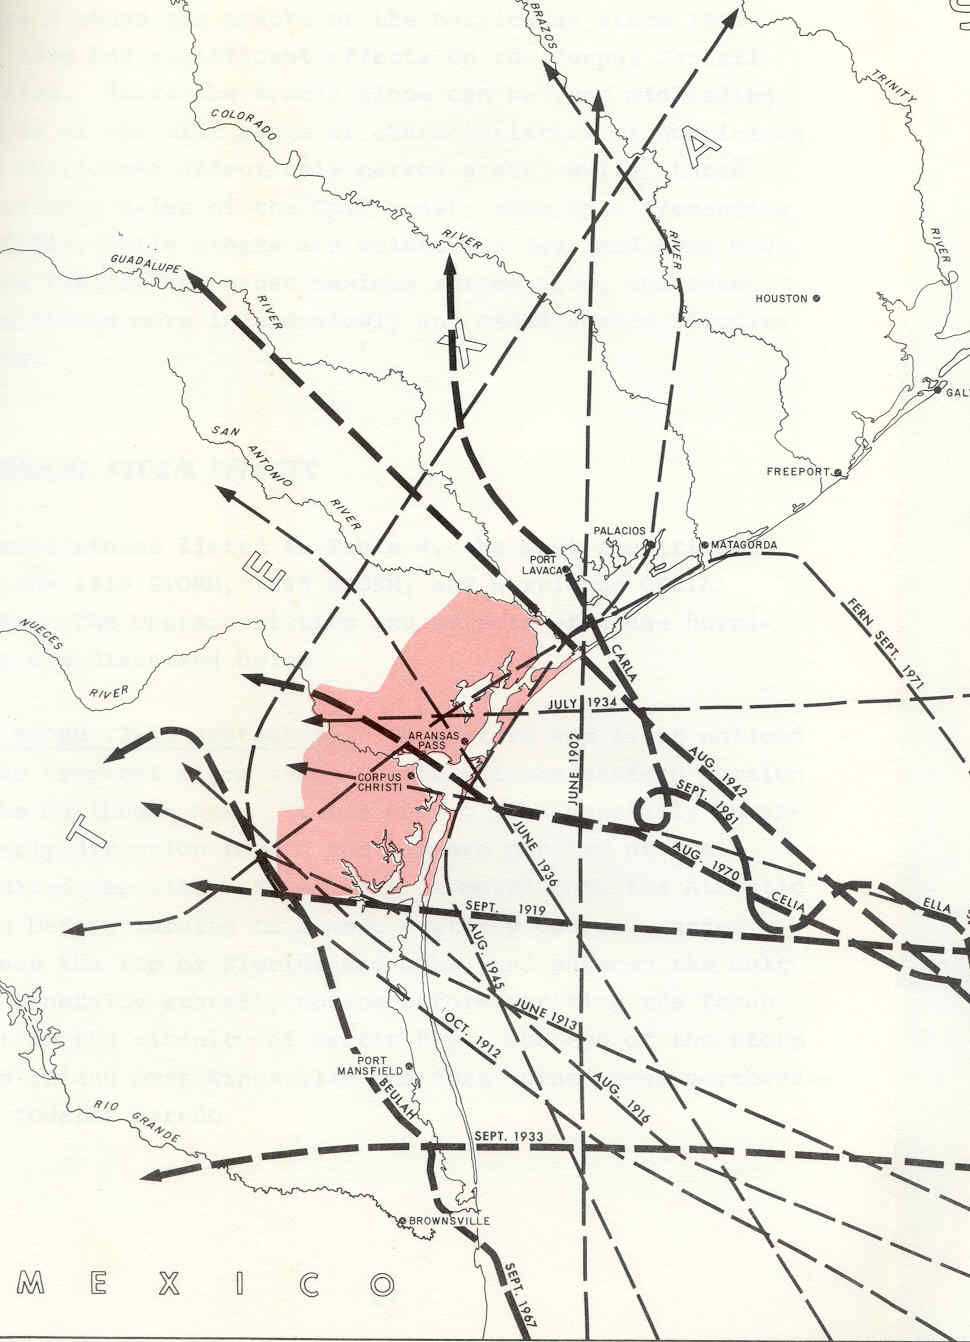
Texas Hurricanes from
1912-1978 Affecting
the Corpus Christi Area
**********************
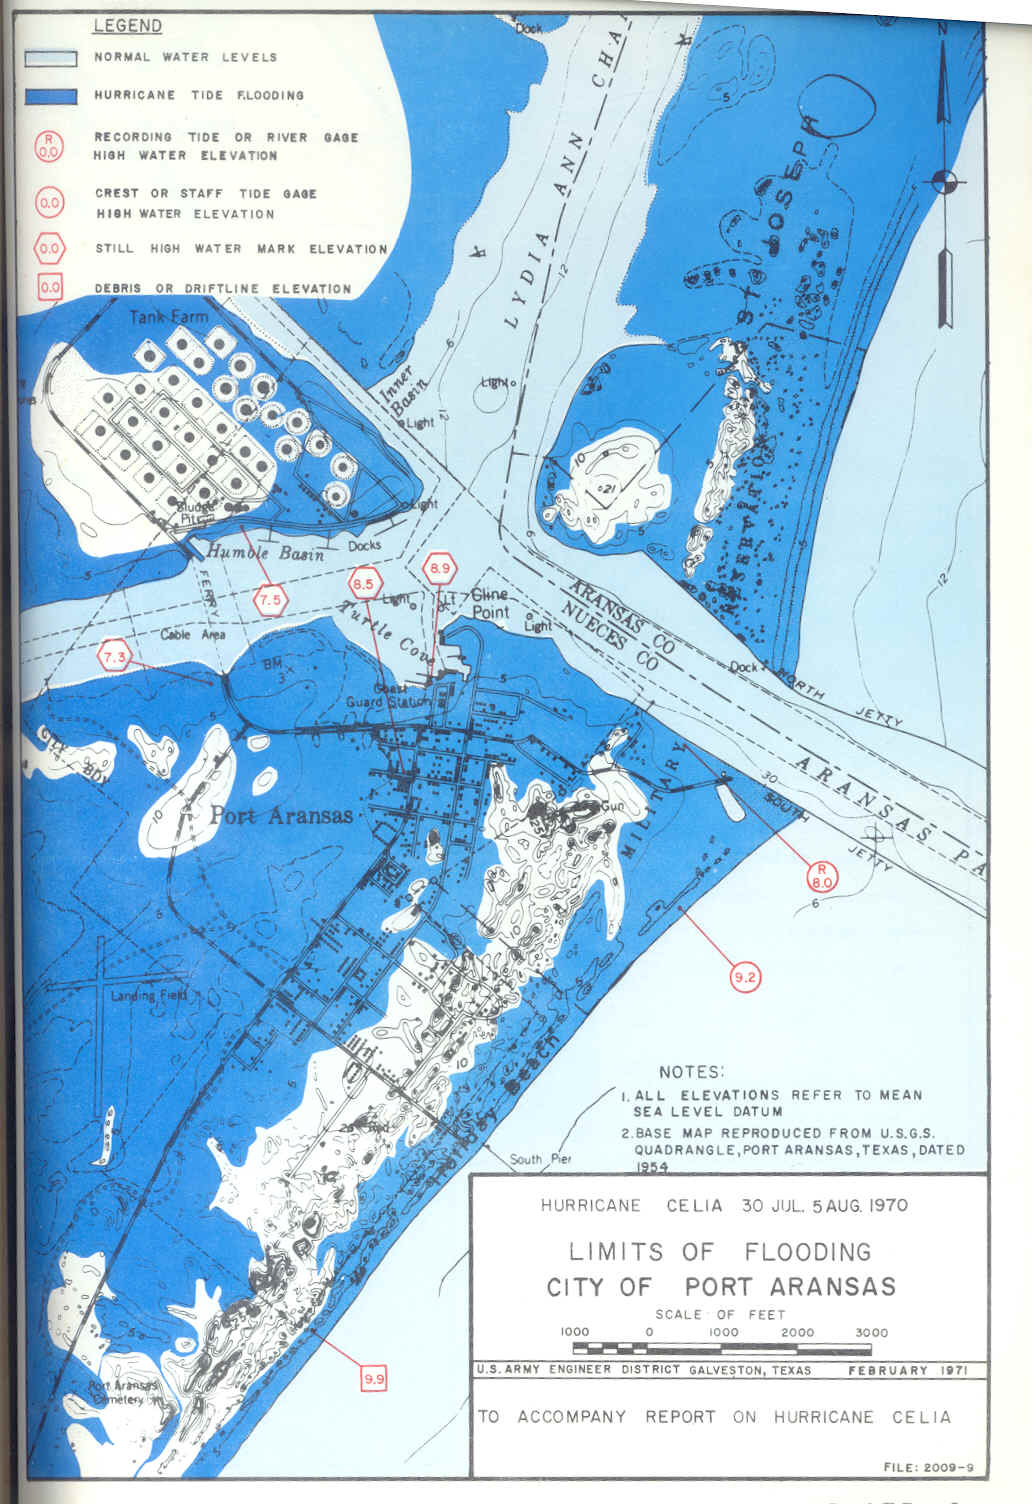
Hurricane
Celia Track, 1970
Hurricane
Celia (1970) Flood Map for Port Aransas
(Dark
Blue Shows Hurricane Flooding,
Light Blue is Normal Water Level)
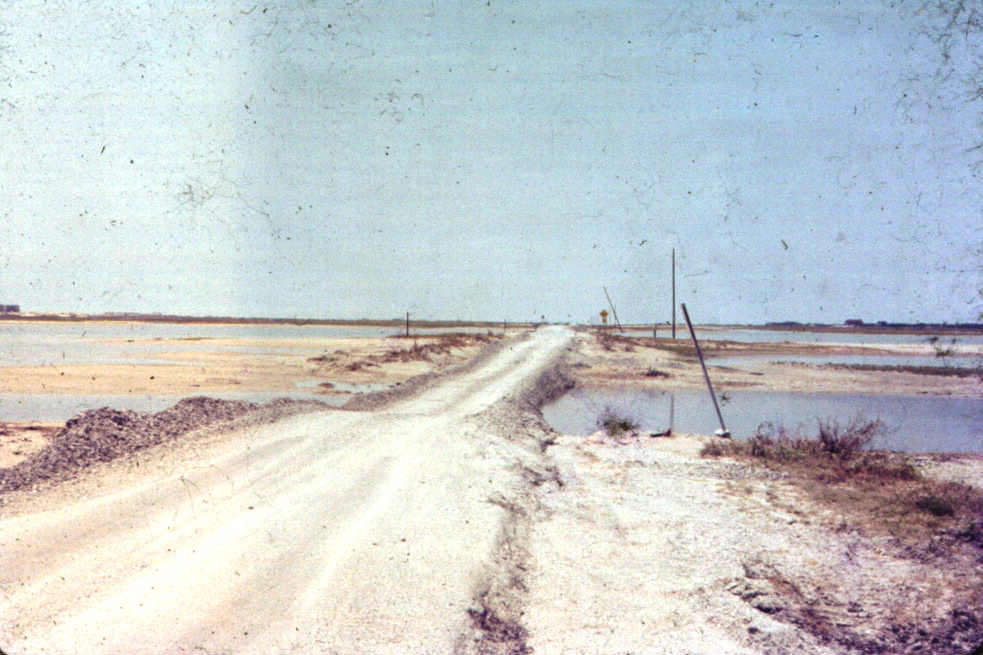
The following photo shows the repairs to the island road in the
vicinity of Corpus Christi Pass after Hurricane Celia. The
road
was cut at the bridges for quite a while after the storm.
This
kind of damage occurs where there is no natural dune seawall to prevent
overwash.
**********************
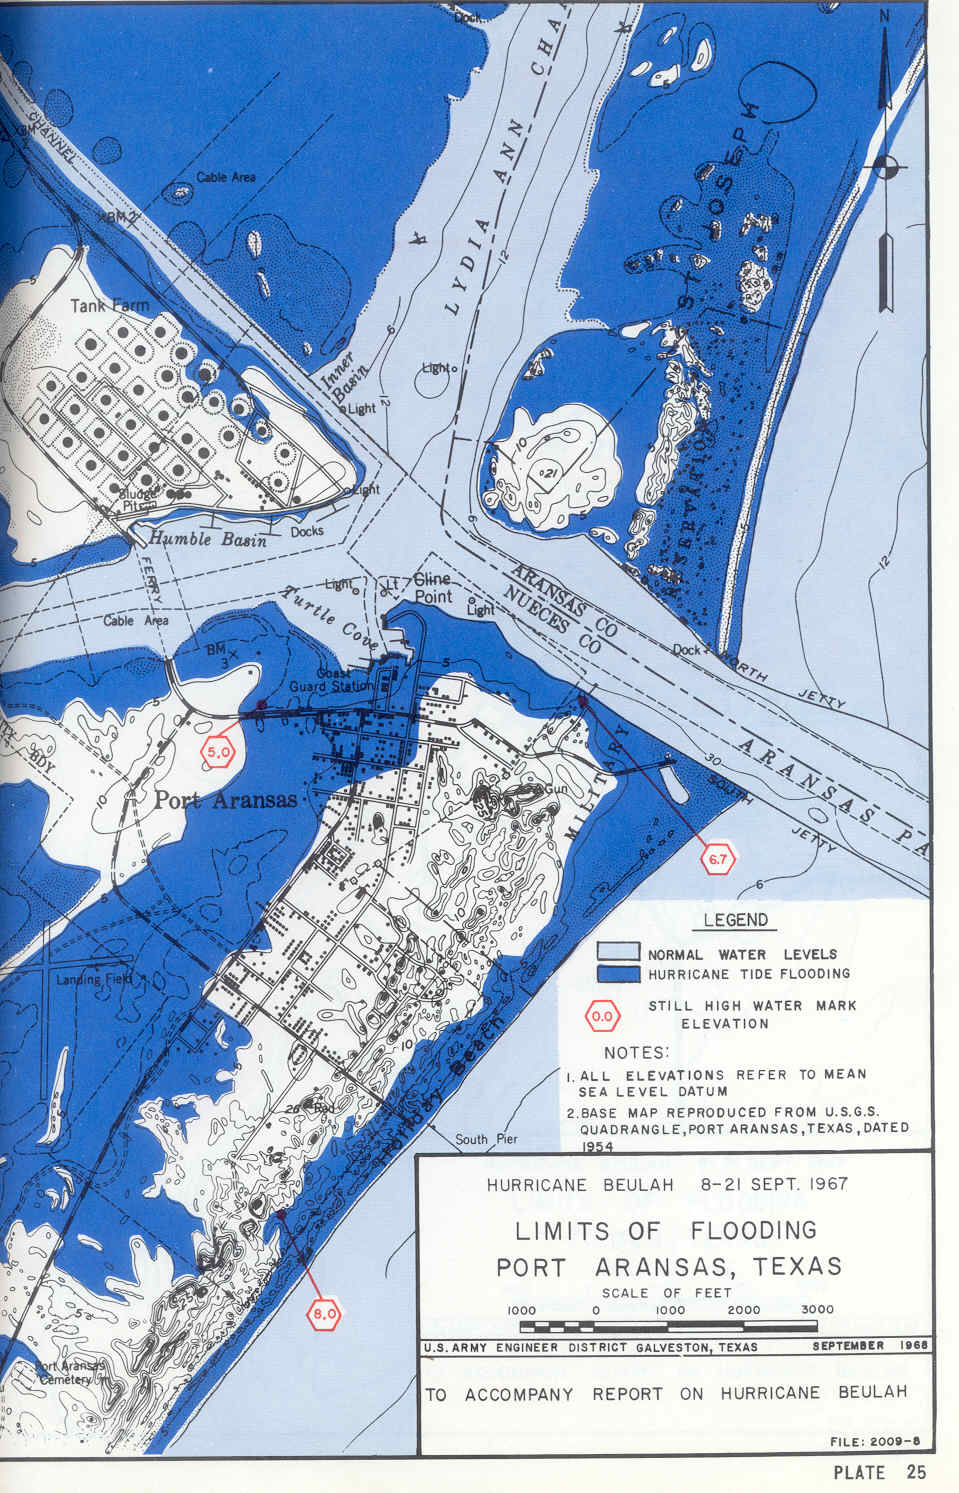
Hurricane
Beulah Track, 1967
The
following hurricane flood maps are from U.S. Army Corps of Engineers
publications
Hurricane
Beulah (1967) flood map for
Port Aransas
(Dark
Blue Shows Hurricane Flooding,
Light Blue is Normal Water Level)
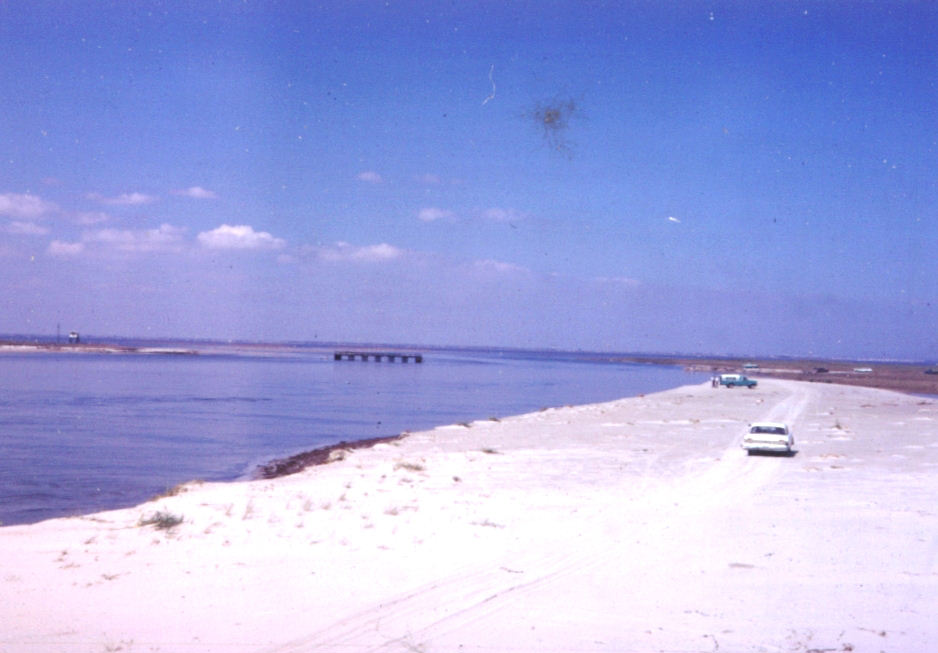
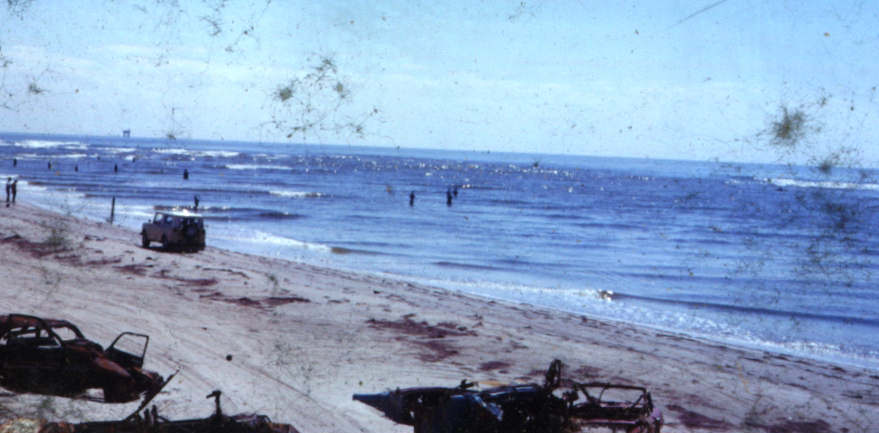
The
following two photographs show
how Hurricane Beulah opened Corpus Christi Pass. Note the
highway
bridge on the island road out in the middle. This is far less
likely to happen where there is a strong natural dune seawall.
Please excuse the condition of some of these old photos. They
have survived several hurricanes.
**********************
Hurricane
Carla track, 1961
Hurricane
Carla (1961) flood map for
Port Aransas
(Orange
Shows Hurricane Flooding, Light
Blue is Normal Water Level)
**********************
Hurricane
Allen Track, 1980
Hurricane
Allen, 1980
Hurricane Allen has 8.9 feet of surge flooding on the beach at Port
Aransas. However, the Corps of Engineers did not produce any
high
resolution surge flood maps in their Allen publication. While
Allen had a significant surge, it did not overtop the dunes.
Allen did however significantly damage the island road down
in
the area of the bridges where there was little or no dune ridge for
protection at Corpus Christi Pass and Newport Pass. The
following
photo shows the island road destroyed by Allen. This is what
can
happen where there is no natural dune seawall.